Beyond
Architecture
Computational design studio building AI tools for architects and designers.
Research-driven computational design studio based in Turkey and the UK. Building the tools that will shape how architecture is designed.
What We Build
Generative AI
Multi-model AI platform for architectural visualization. Sketch to render, design iteration, material swap, and moodboard creation.
→SpaceCraft
LiDAR 3D Scanner for iPhone. Scan any room, object, or site in minutes with on-device AI mesh generation.
→Urban Analytics
GIS-powered data visualization and urban simulation for large-scale masterplanning decisions.
→Architecture
From concept to construction. High-performance buildings with complex geometries and intelligent systems.
→Custom Software
Bespoke plugins for Revit & Rhino, plus web-based tools to accelerate your design practice.
→The Manifesto
Our vision for the architect's role in the age of artificial intelligence.
→ Sketch
  Render
 Archly.ai
AI design assistant for architects. Multiple generative models — image, video, 3D, and realtime — tuned for architectural workflows. From rough sketch to polished presentation in seconds.
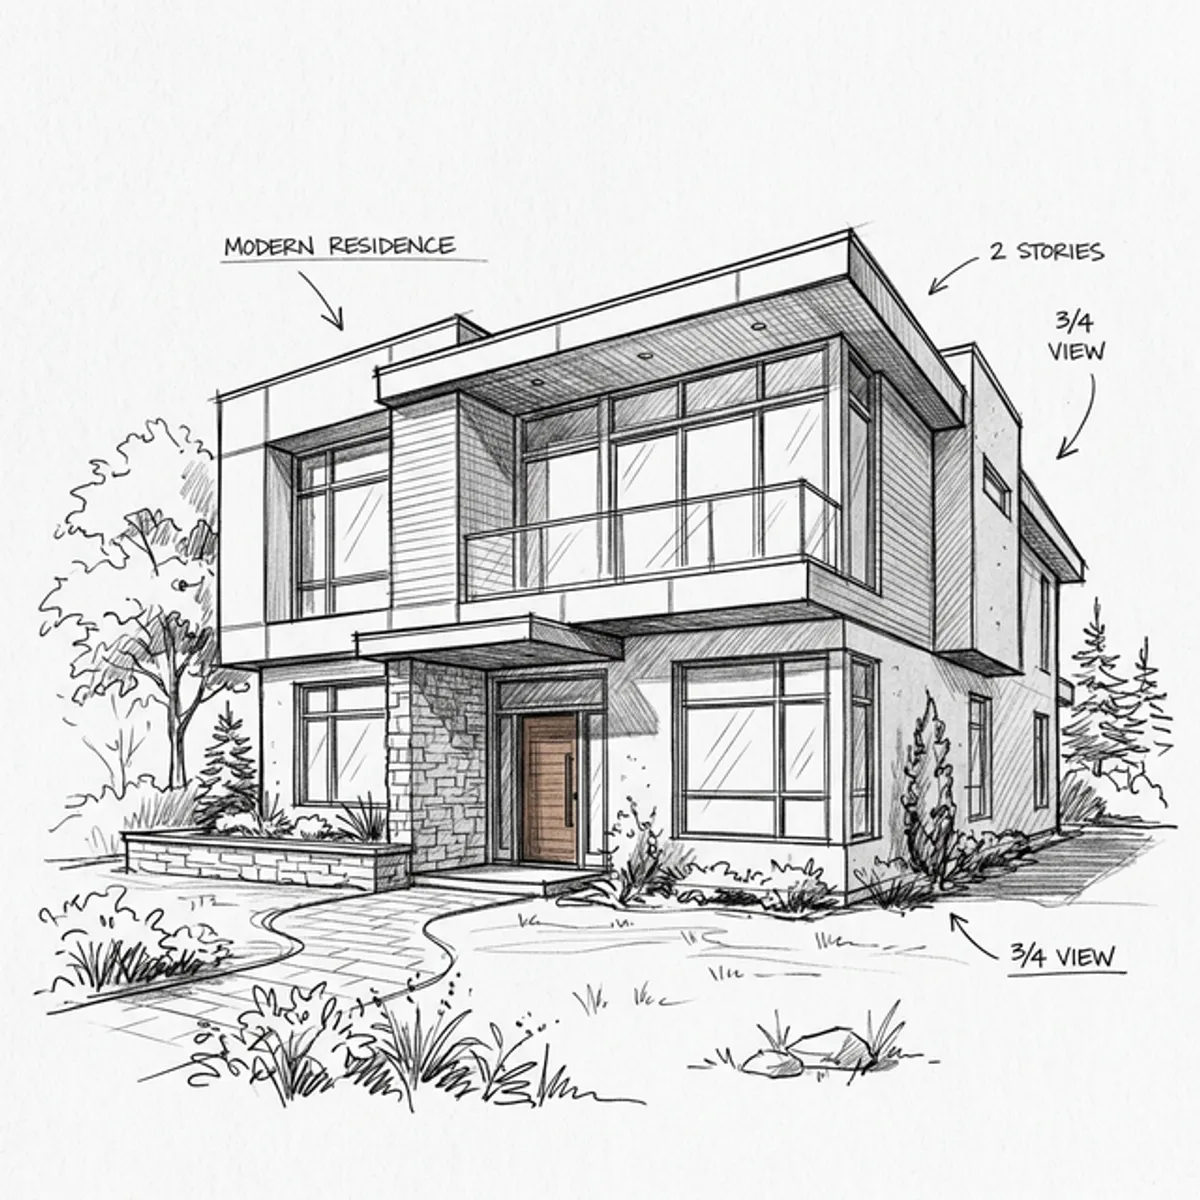
Sketch to Render
Upload hand sketches or plans, get polished architectural visualizations in seconds.
Design Iteration
Describe your vision or upload a reference. Generate variations and refine step by step.
Image Editing
Swap materials, change lighting, alter styles. Edit any render without starting over.
Video & 3D
Generate walkthrough videos and 3D models from your designs. Full creative pipeline.
Selected Work

Archly.ai
AI-powered massing studies. Sketch to render in seconds.
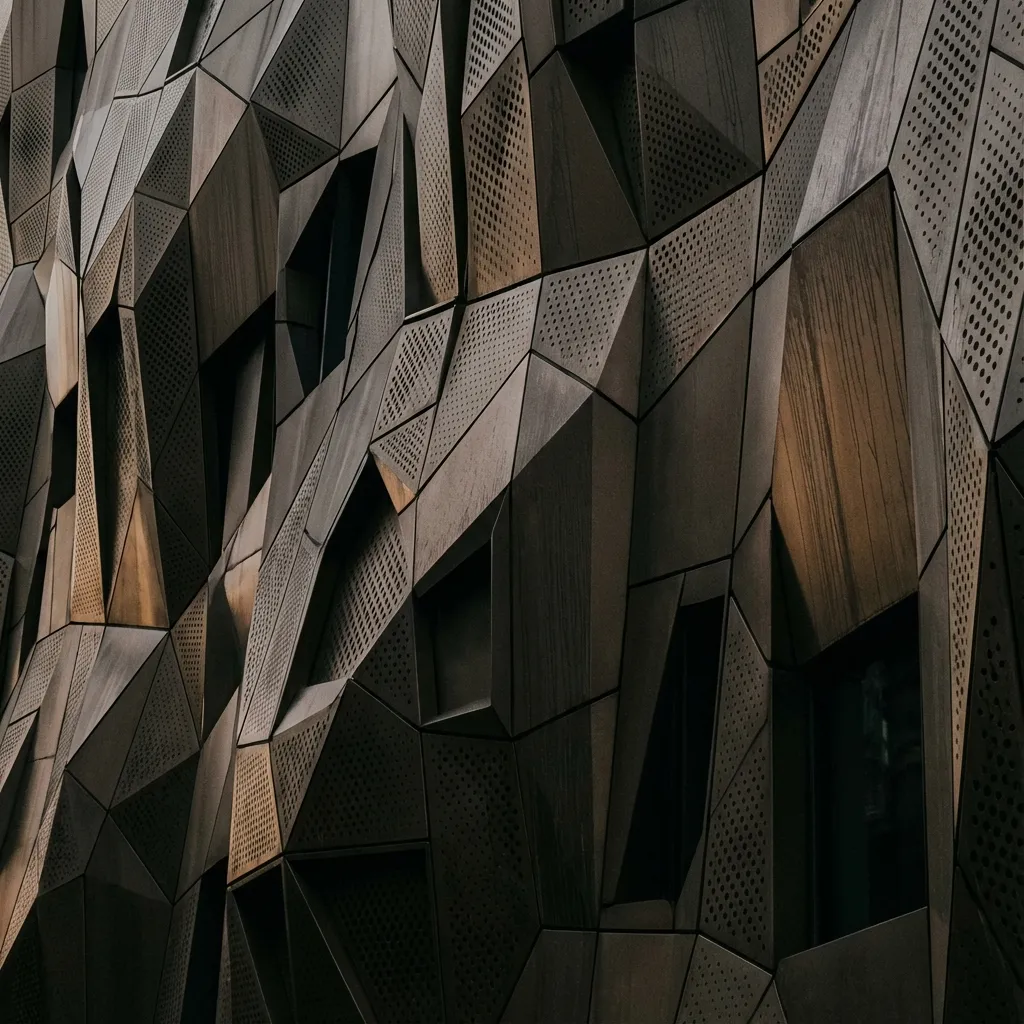
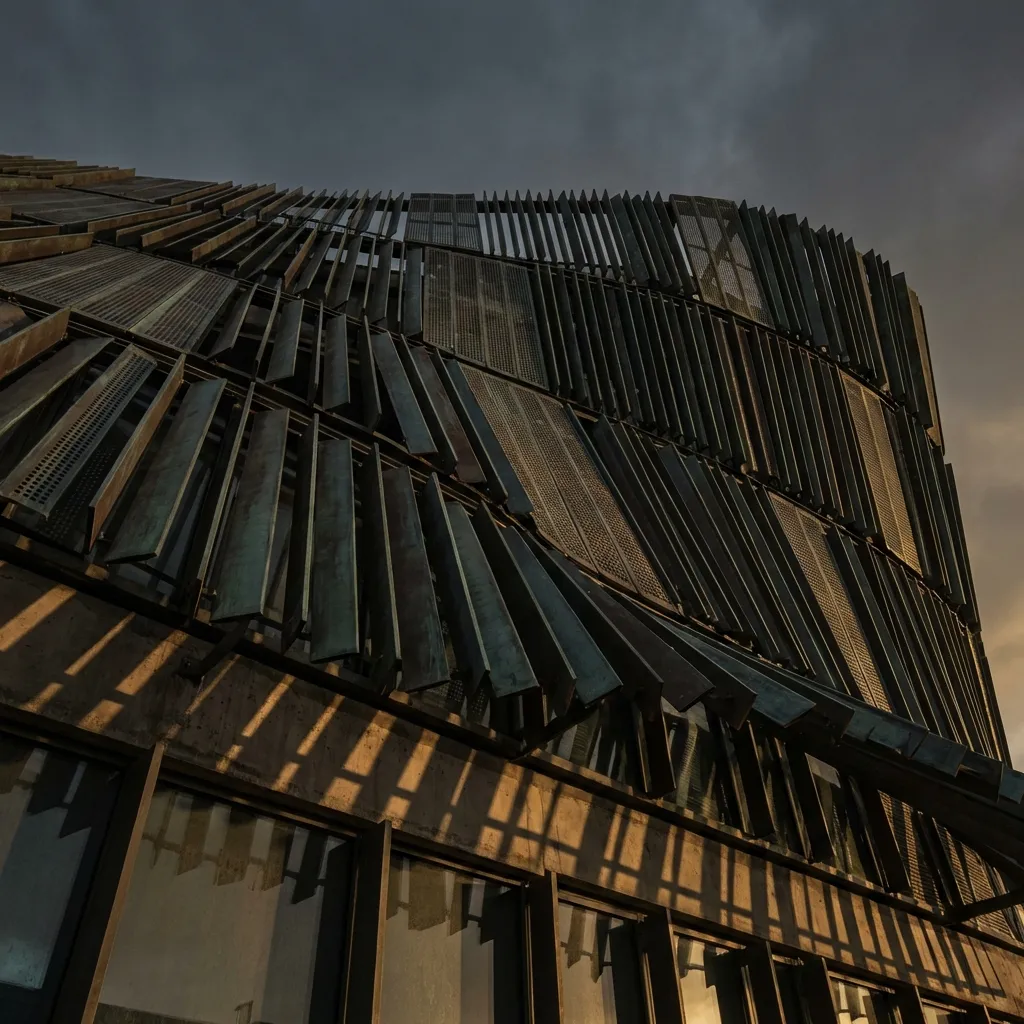
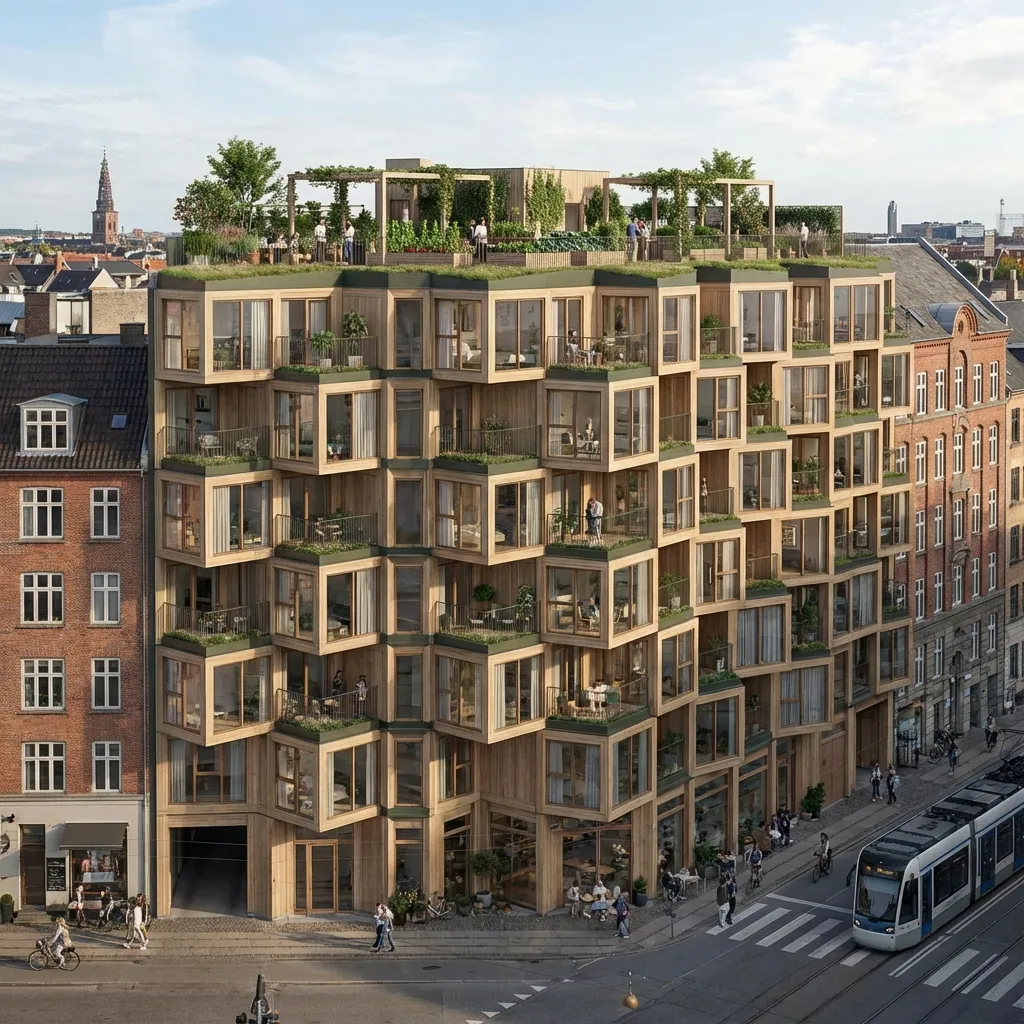
Generative Facades
Self-shading geometries for high-performance envelopes.
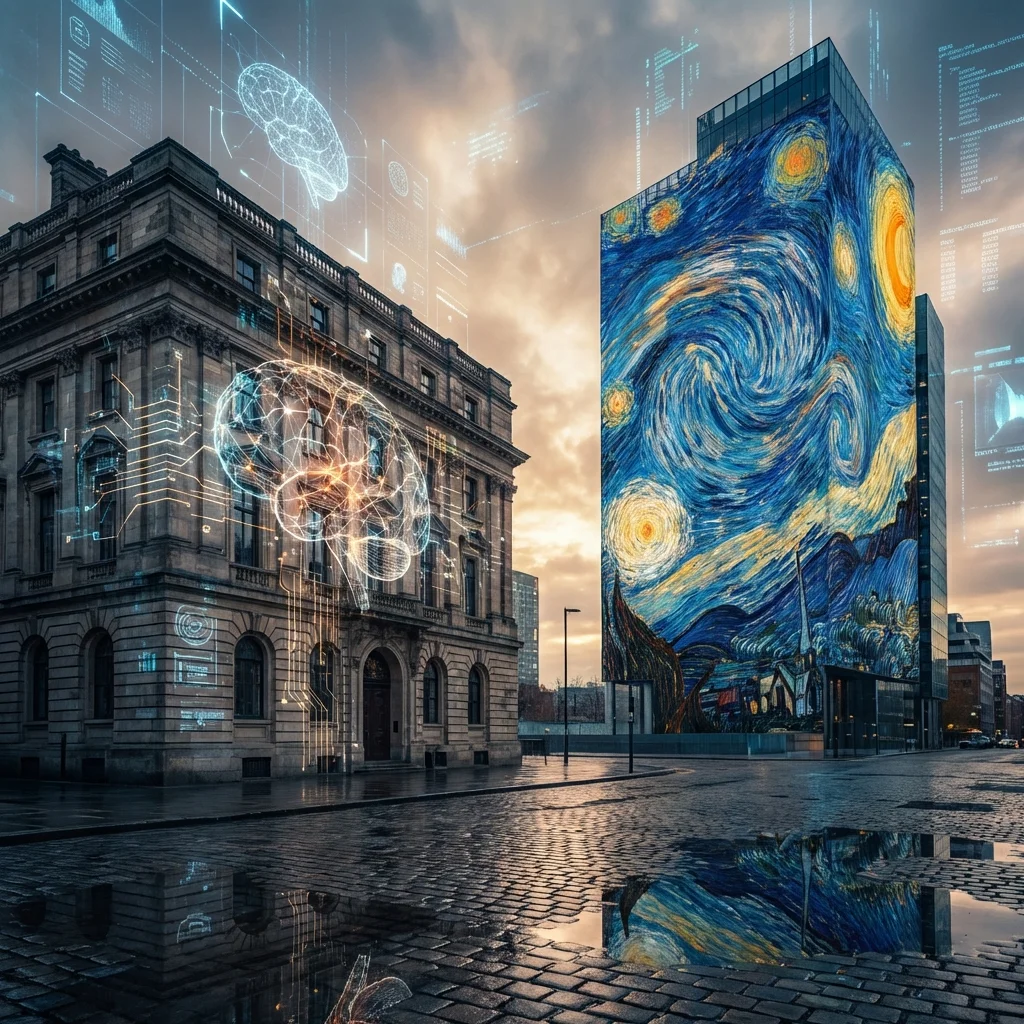
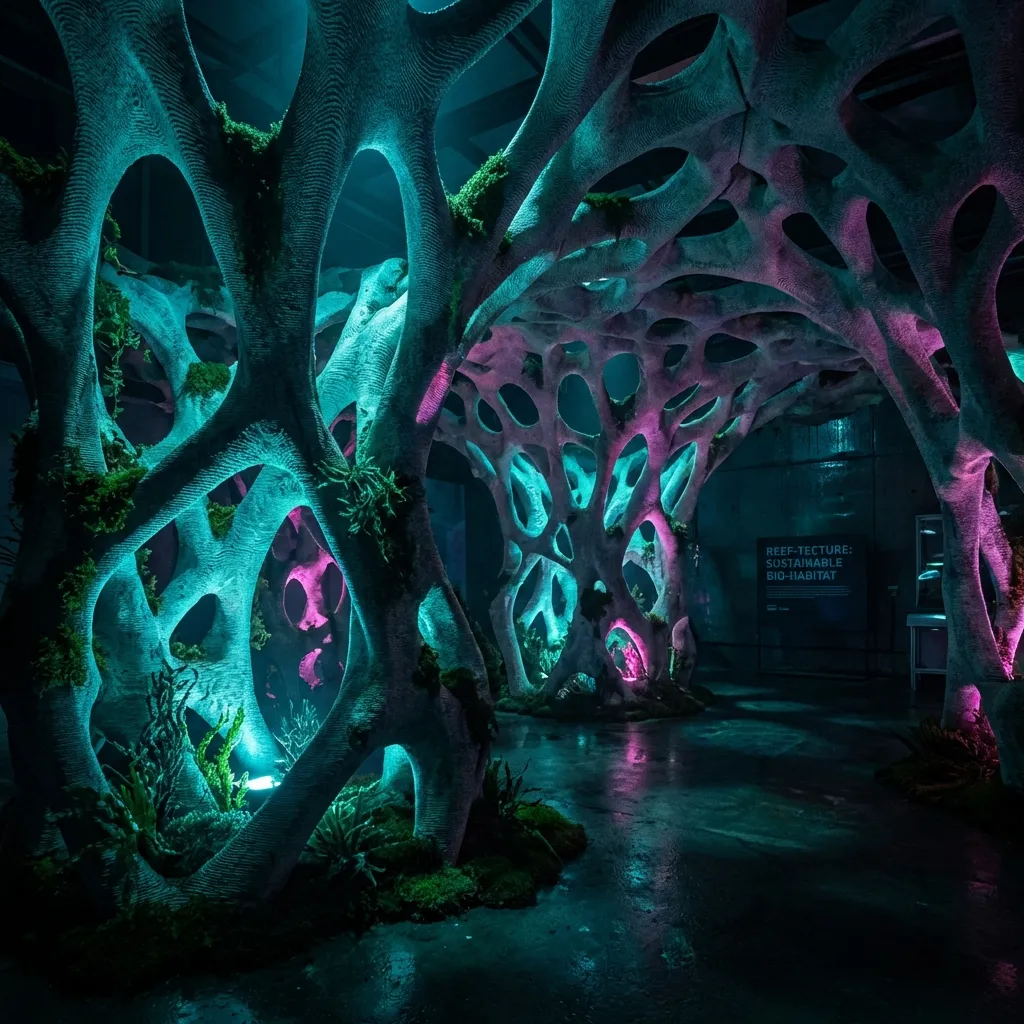
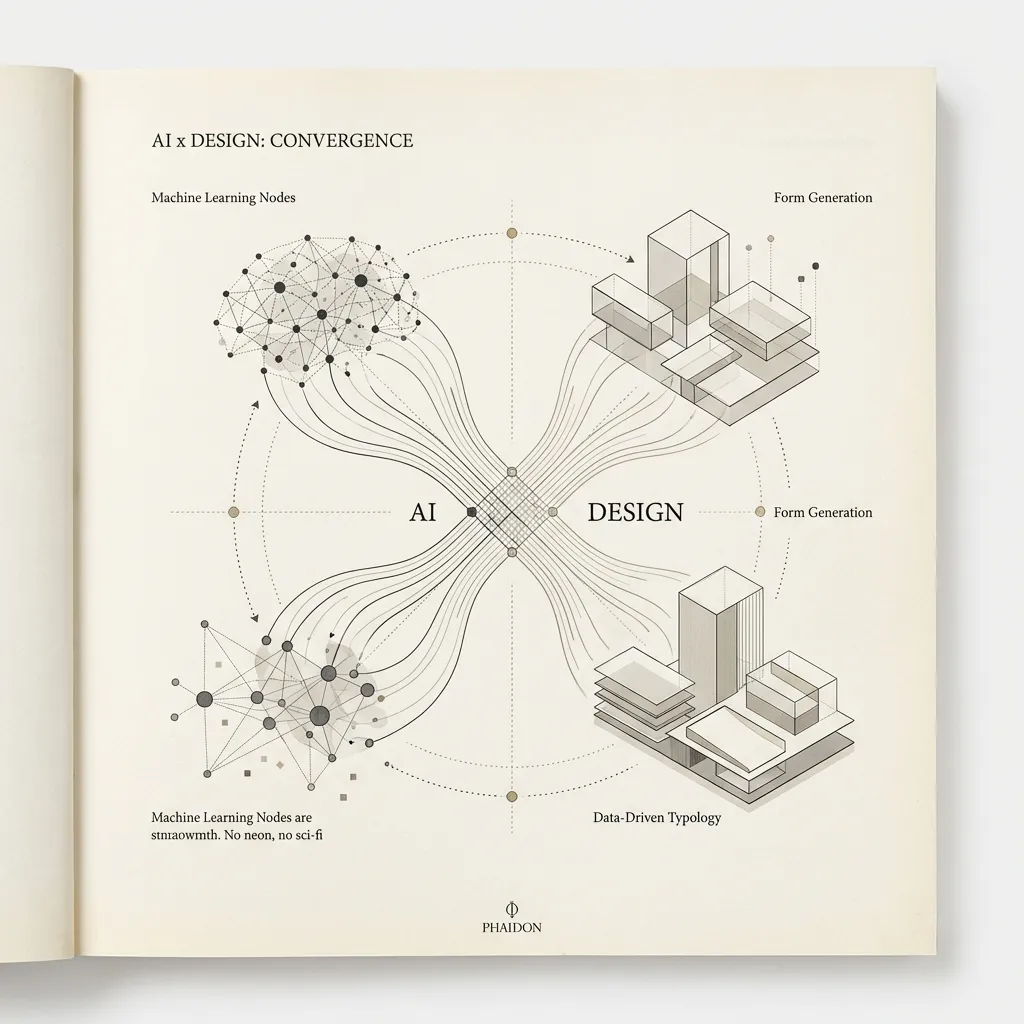
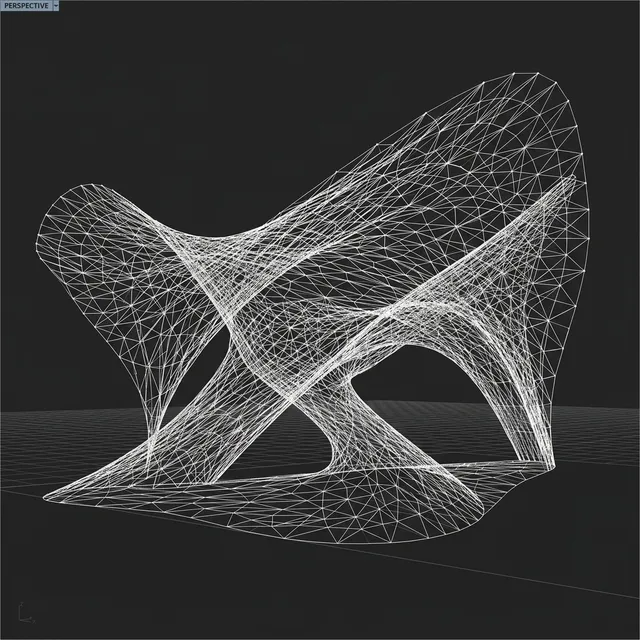
AI Form Finding
Machine learning for novel architectural morphogenesis.
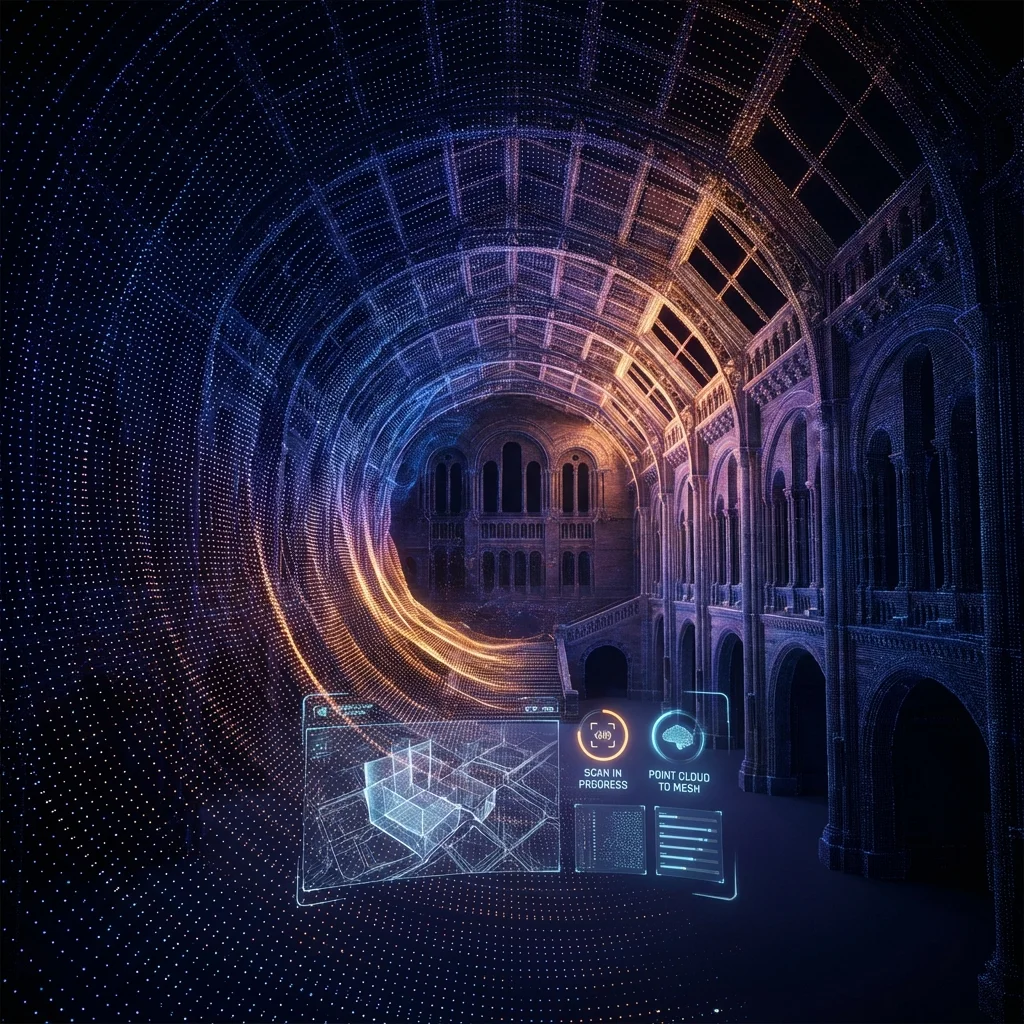
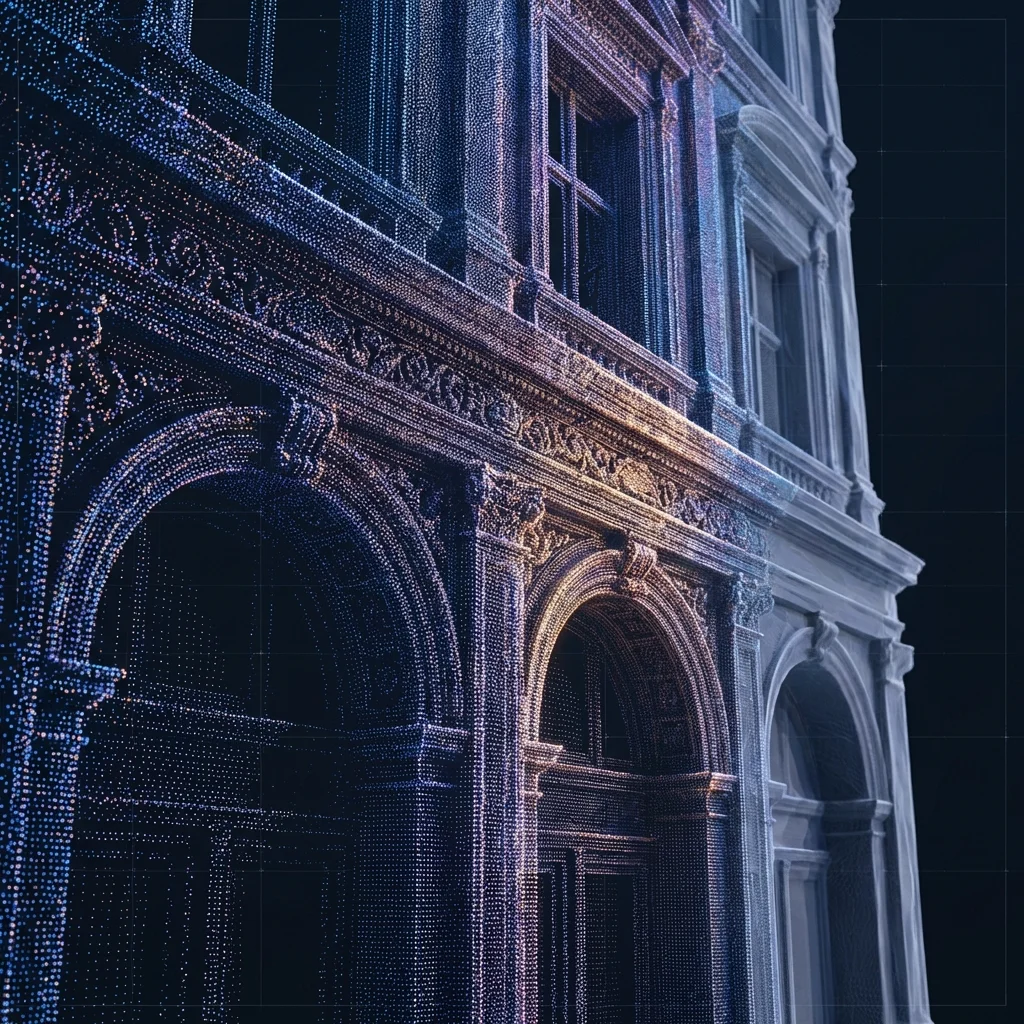
Spatial Computing
LiDAR scanning and point cloud processing for architectural analysis.
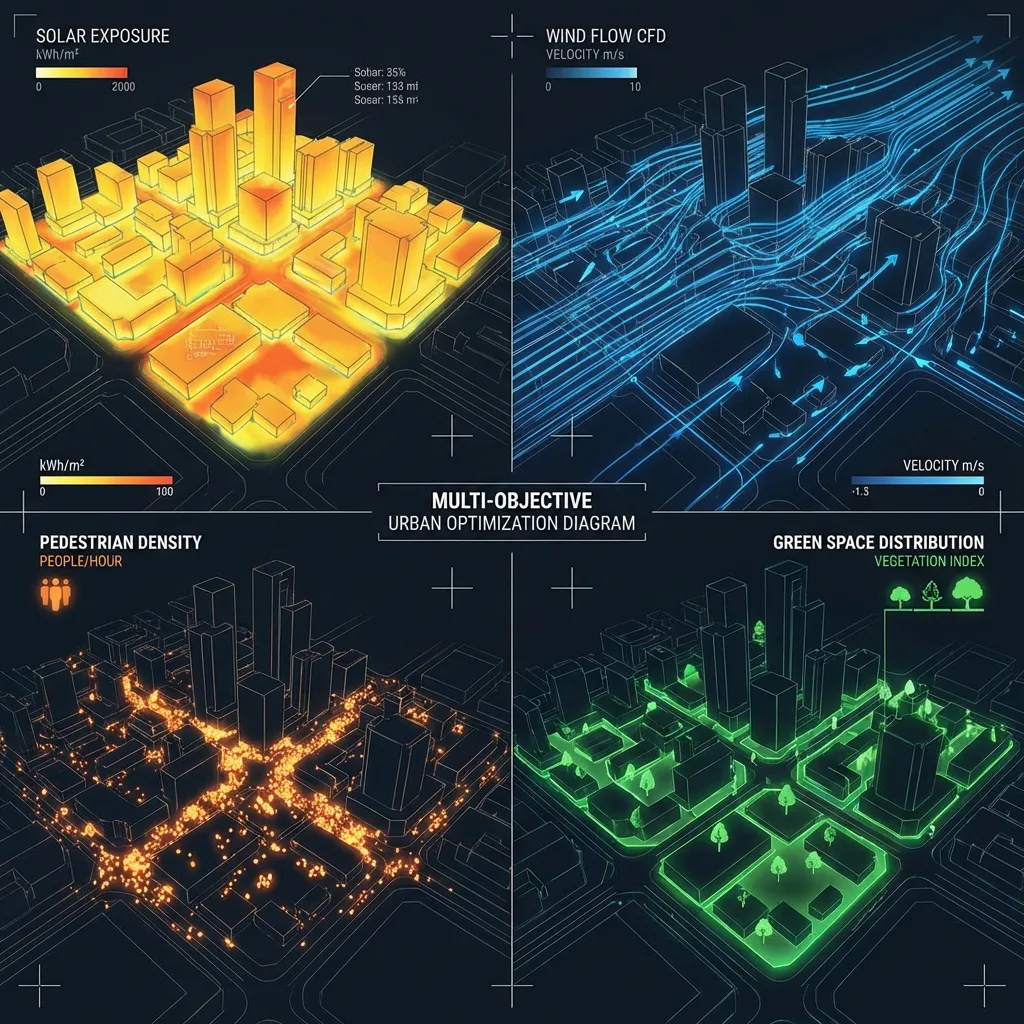
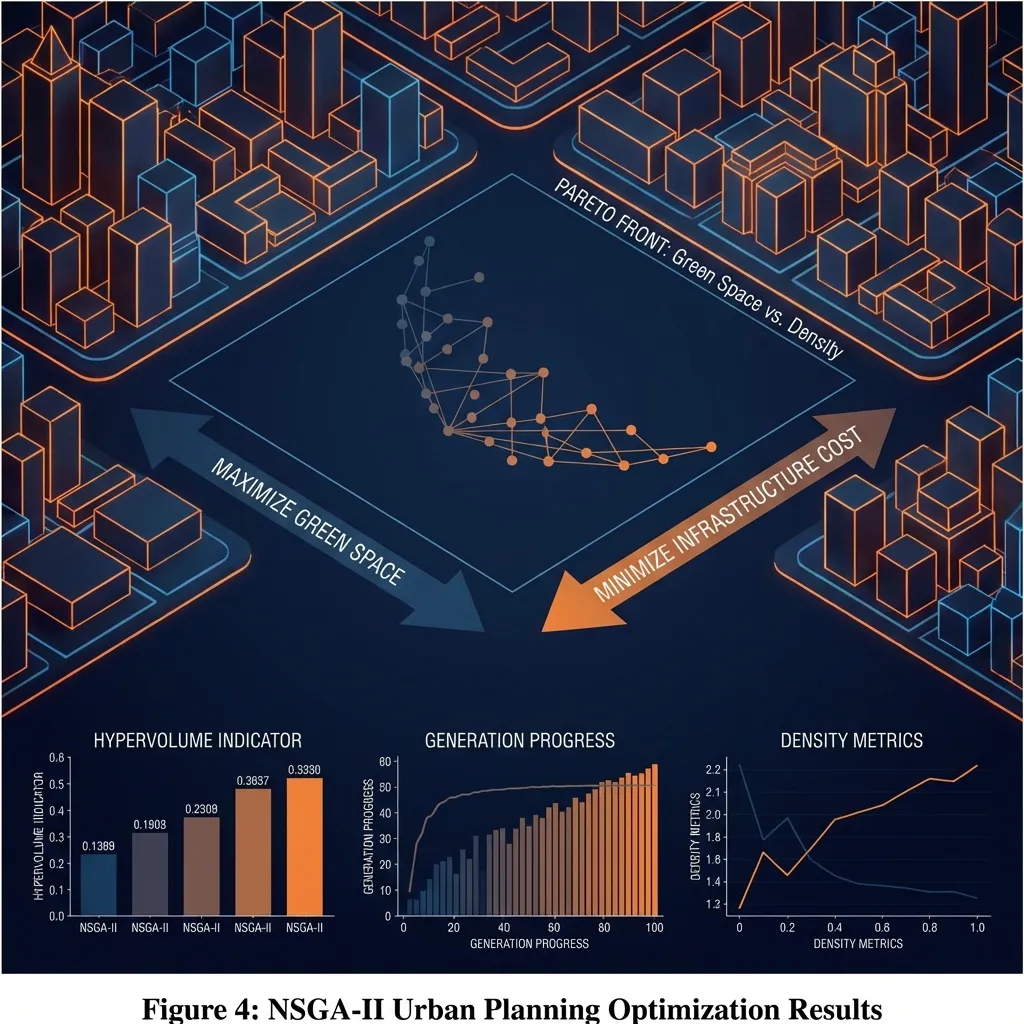
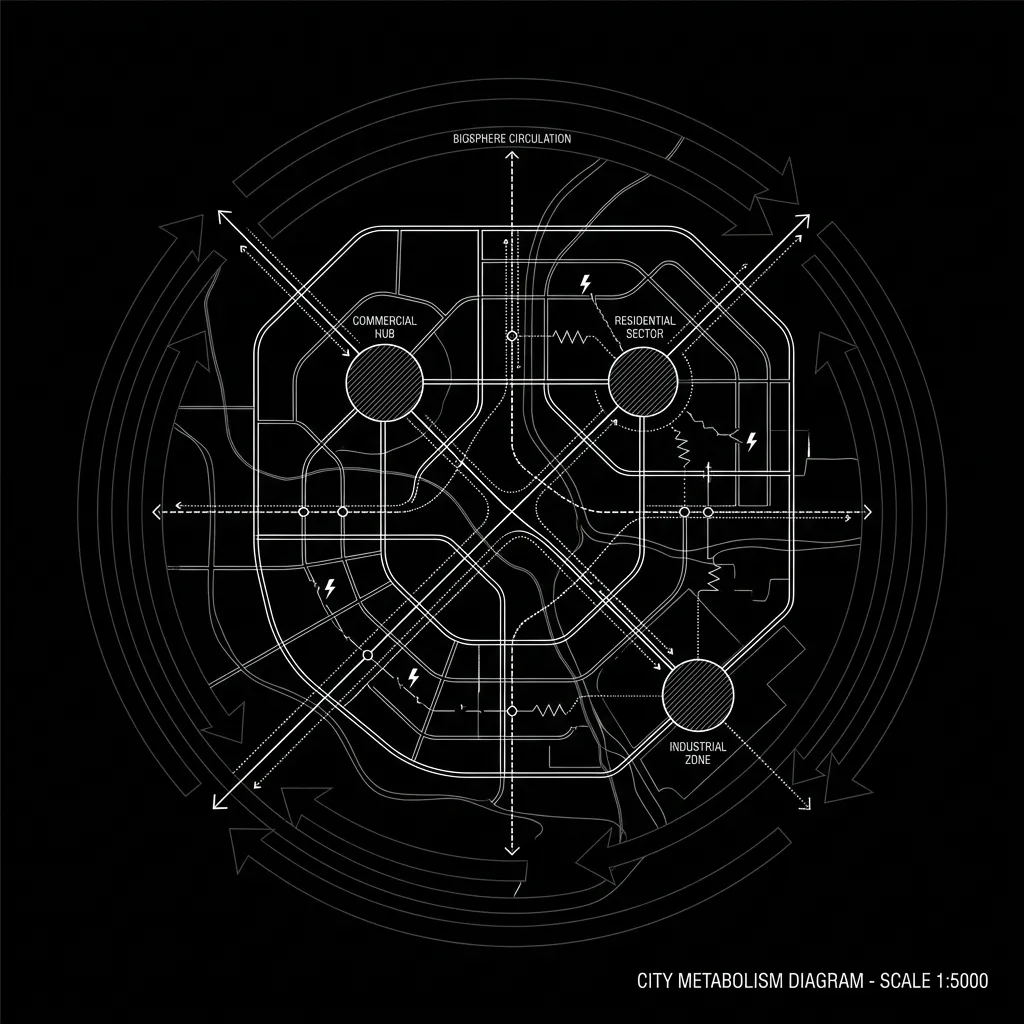
Computational Urbanism
Data-driven density optimization using evolutionary algorithms and GIS analysis.
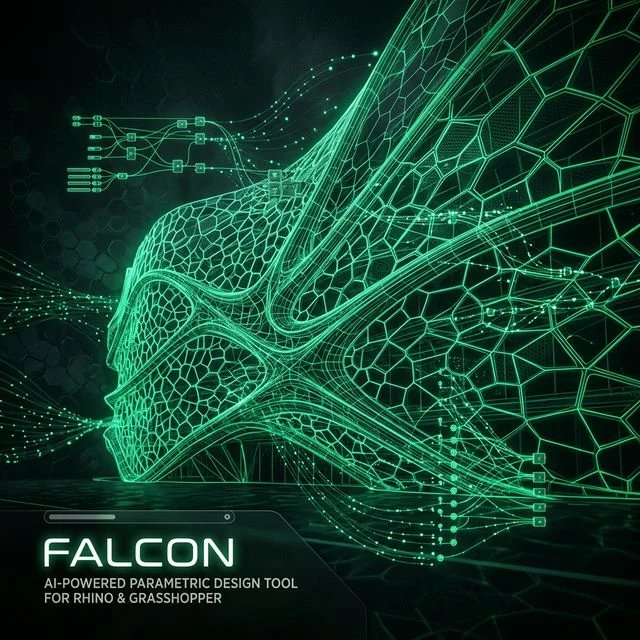
Falcon AI
Pro Grasshopper copilot in development for canvas planning and visual debugging.
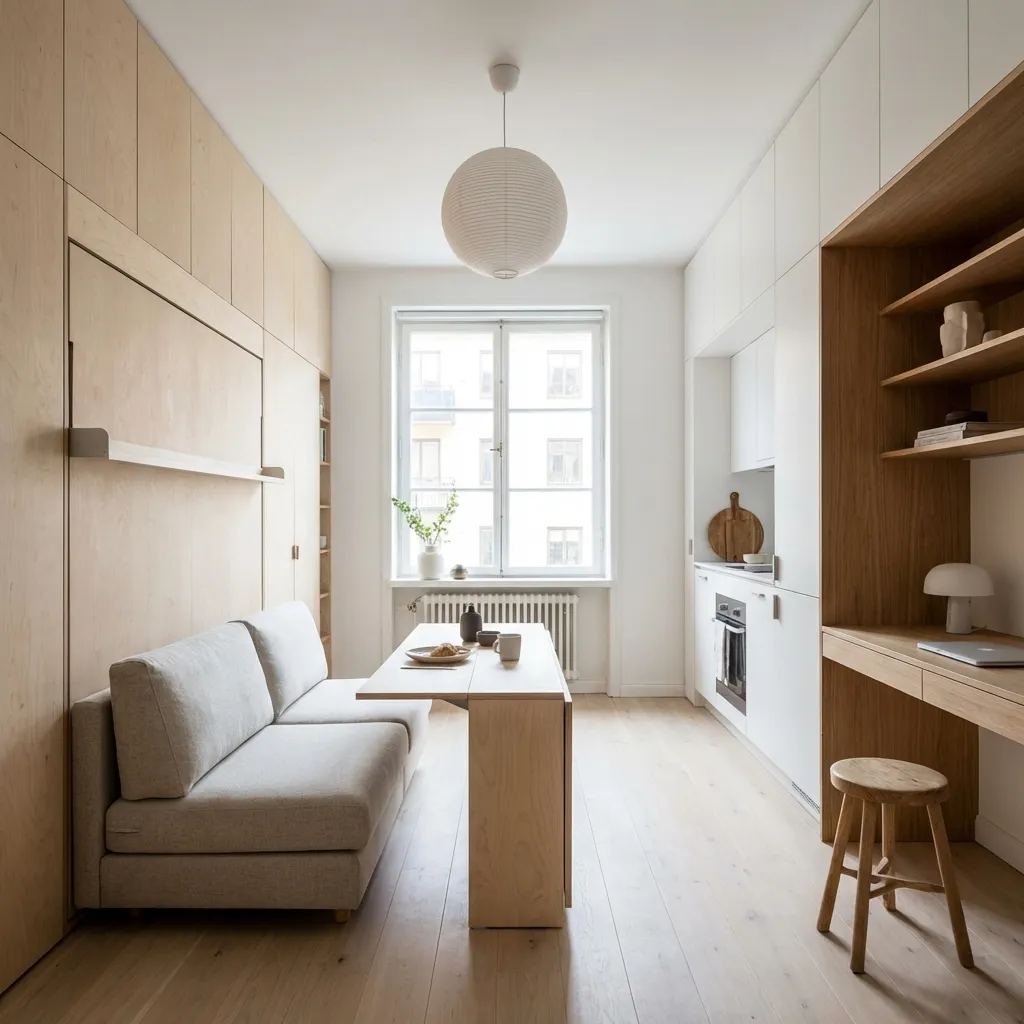
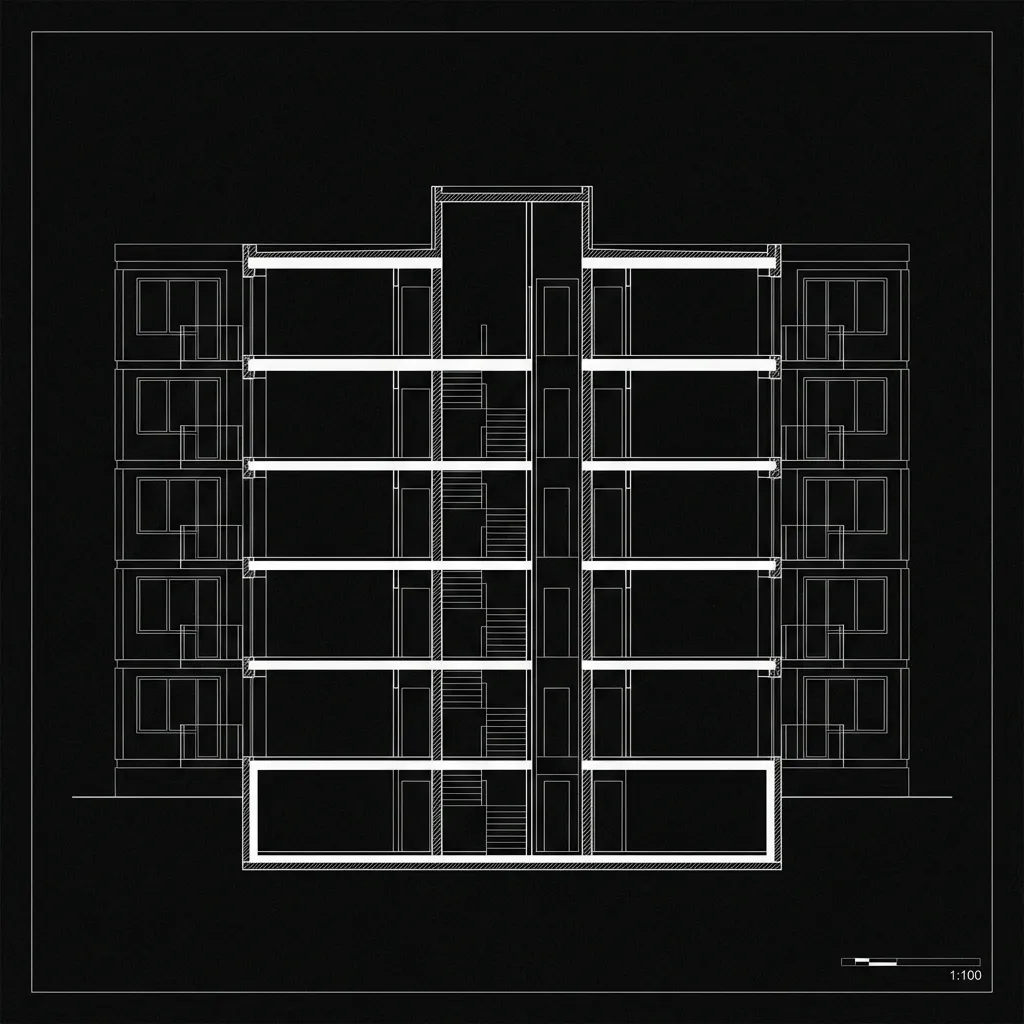
Compact Living
Micro-apartment optimization using LiDAR and parametric design.
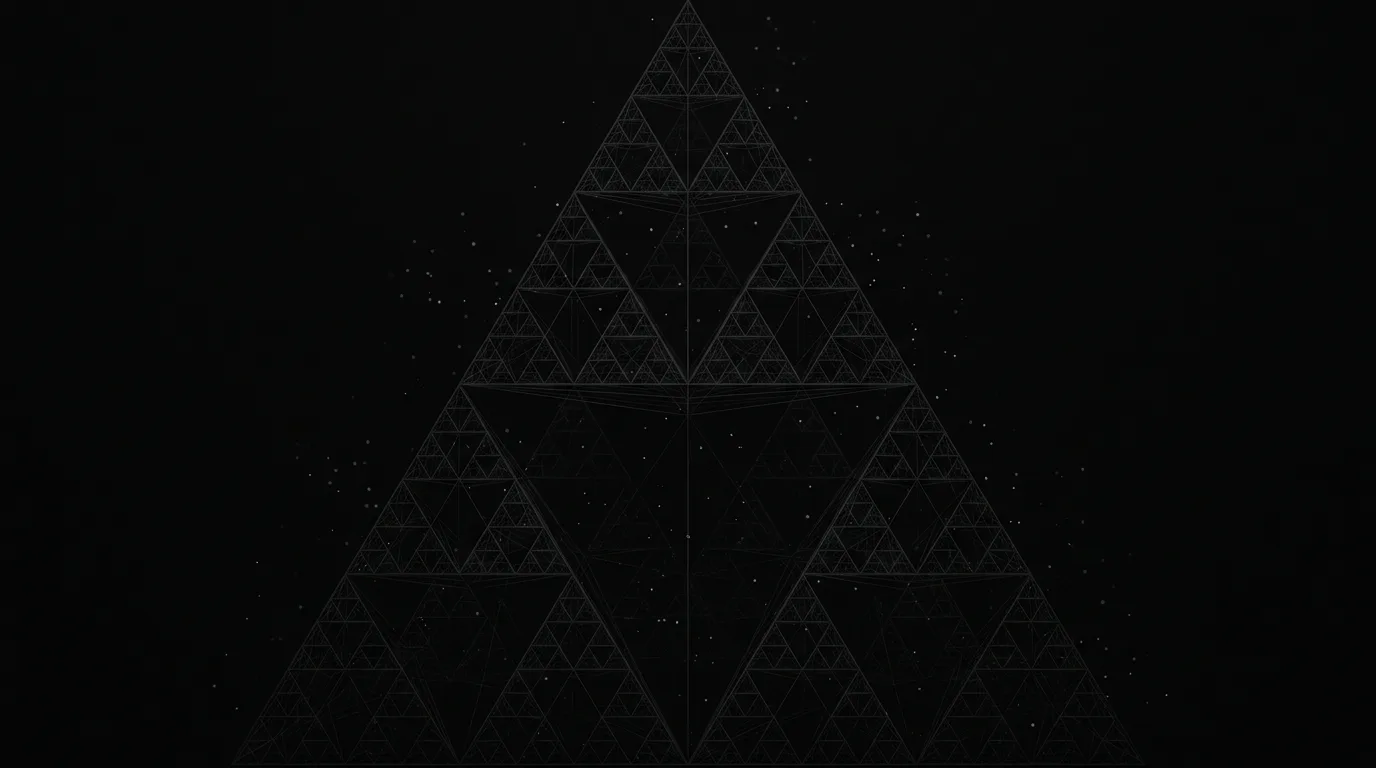
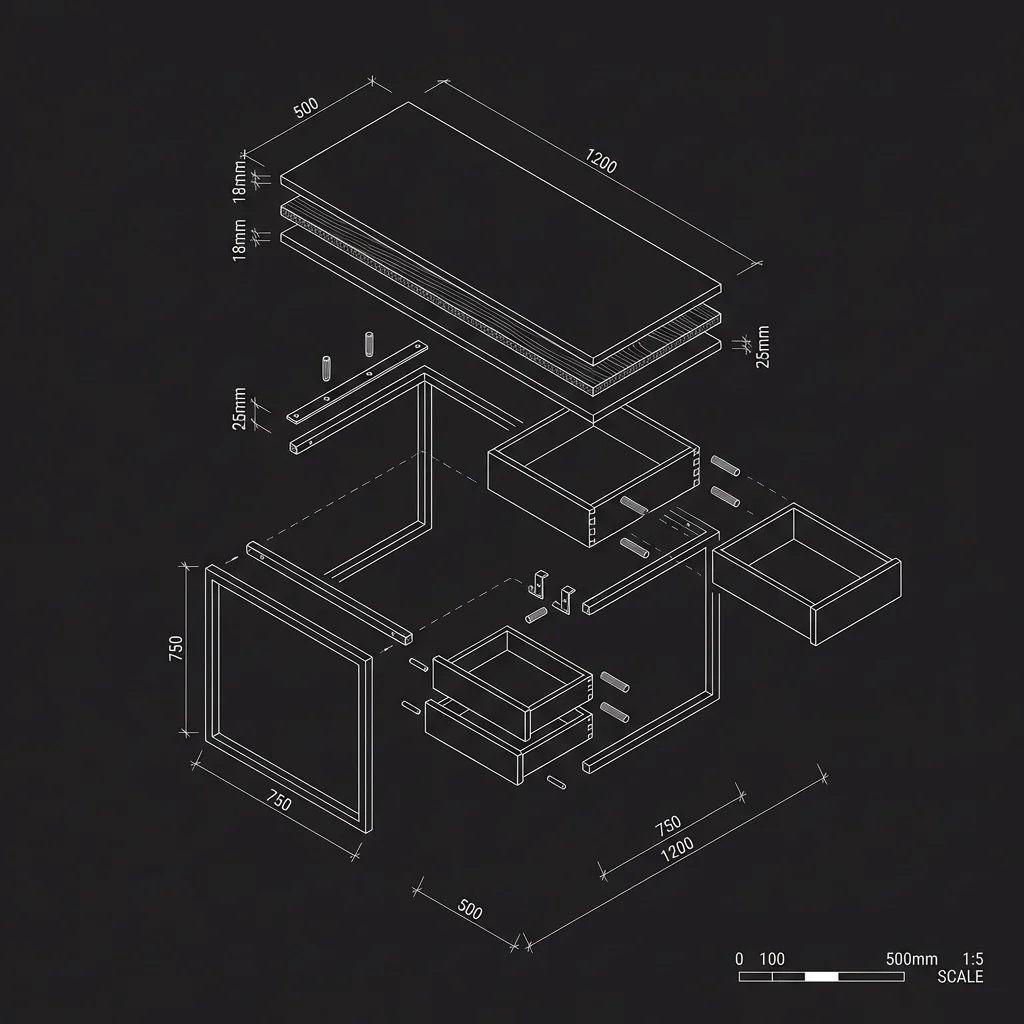
From Furniture
to City.
Design is a fractal continuity: every scale influences the next. A chair informs a room, a room shapes a building, a building defines a neighborhood, a neighborhood organizes a city.
Let's build something intelligent.
Whether you need an AI tool, a custom plugin, or a full architectural design, Fraktal is your computational partner.
Start a Conversation